
At work, I recently used a bode plotter to characterize the gain and phase margins of a high-performance buck converter. I found this device to be fascinating and wanted one for myself at home. I could not think of a reason why, but then again, why not?
I thought of combining LXI on my oscilloscope with the USB of my function generator with the use of Python. GitHub user JarJuk luckily already made an interface between Python and the UTG962E, now I just had to control my oscilloscope before I could combine the two.
As luck would have it once again, GitHub user JBTronics already thought of exactly this idea for the DS1054Z, but with another function generator. The only thing left for me to do now was to use the combine the UTG962E and DS1054Z interfaces and let them store the data in a CSV.
I was surprised with how much I remembered of Python, as it has been 4 years since I last used it. The UTG962E has a very clunky control through USB and each character for the frequency has to be put in sequentially, increasing the time between measurements drastically. For this, I integrated a flag within the command options that would translate the float frequency values to integers and remove possible duplicates. This was the “–fast” flag. This reduces the amount of characters needed to set a frequency, reducing the time between measurements.
The amount of steps in the measurements can also be selected, this is the largest determining factor for the measurement time.
The DS1054Z is controlled through LXI and not USB as to have it unconnected from USB ground, which the UTG962E is connected to. The program will automatically search for the oscilloscope on the network, however if it can’t find it, you can manually add it with the “–ds_ip” flag followed by its IP-address.
Then, once both are initialized, the function generator will set itself to its starting frequency and peak to peak voltage, to which the oscilloscope sets itself to the most suitable value on both channels.
Then the measurements are performed and the output is stored in a .CSV file containing both gain (in V/V, not dB, I process it to dB in MATLAB) and phase in degrees.
To test the functionality of the scripts, I created a simple high-pass RC filter as seen below.
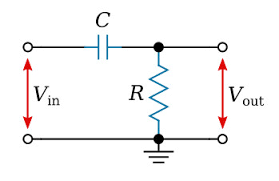
This filter has a resistance of 10kΩ and a capacitance of 15 nF, making its pole around 1 kHz.
This gives us the following “ideal” transfer function.
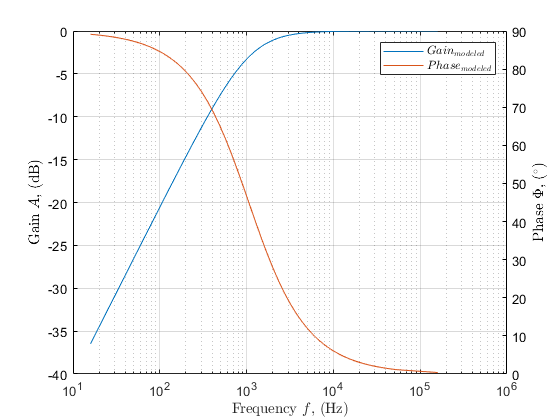
Now it was time to test the program. I opened up my Jupiter notebook and entered the line:
%run bode.py 100 100000 100 --output out.csv --phase
This enabled the function generator to sweep from 100 Hz to 100 kHz at 100 measurements. As the frequency was set on the function generator, the script started to sample required amplitude and phase values from the oscilloscope. After quite some time, the program finished and spit out the output file.
Processed by MATLAB, it looks as follows:
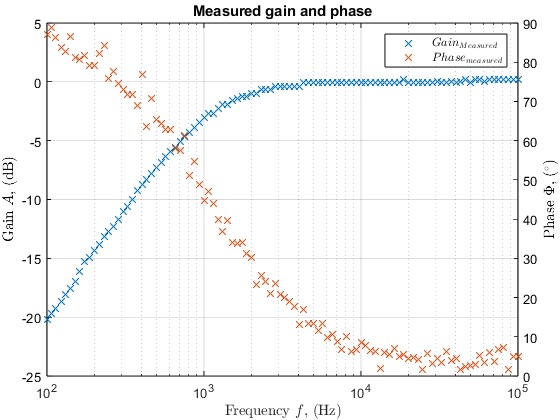
This still looks rather rough on the phase side, so I smoothed it with a Savitzky-Golay filter (Framesize 15, order 3). This made the plots look better and less jagged as seen below.
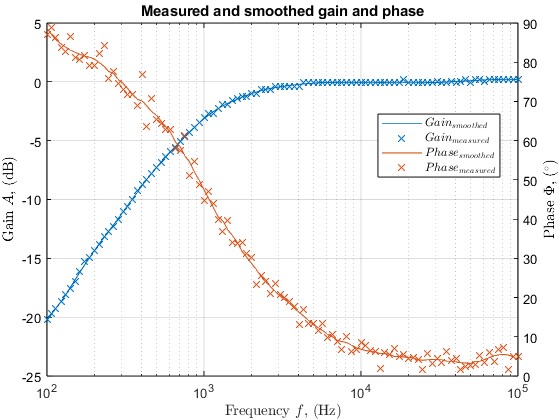
Here, you see the measured gain and phase values of the low pass filter compared to the smoothed values. Let us compare it to the ideal bode plot generated by MATLAB
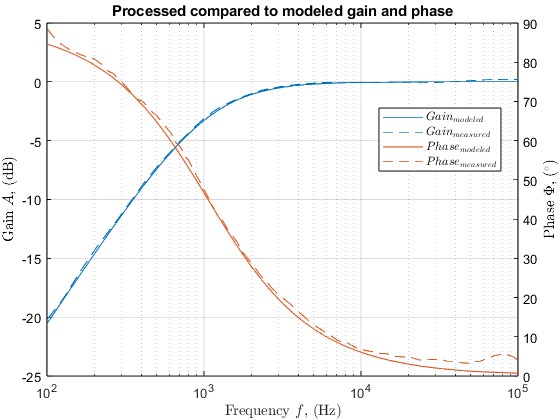
It is notable that the modeled and measured gain and phase follow the curve very well. I am very happy with these results.
It was fun brushing up on my Python skills and combining it together with hardware and MATLAB. This tool will be used for measuring the stability criteria of power supplies among other things.
If you are interested in the code, let me know!
Leave a Reply